Power Bi: Sync Slicers From Different Tables
Jan 30, 2024

Resources to help build your fundamentals: Learning Power BI? Data fundamentals are critical for this process to be easier. I've assembled a few DataCamp courses to help. I earn a small commission if you click and purchase.
Introduction to Power BI course: Master Power BI basics and learn to build impactful reports.
Exploratory Data Analysis in Power BI course: Learn about Power BI's Exploratory Data Analysis (EDA) and enhance your reports.
Introduction to SQL course: Learn how to create and query relational databases using SQL in just two hours.
Introduction to DAX course: Learn the fundamentals of Data Analysis Expressions (DAX) such as calculated columns, tables, and measures.
Database Design course: Learn to design databases in SQL to process, store, and organize data in a more efficient way.
One of the most valuable features in Power BI is slicers, which let you filter data to better understand it.
What if you want to synchronize slicers across different tables or data sources in your report?
In this blog post, I'll explore the concept of synchronizing slicers across different tables in Power BI and how to implement it effectively.
Understanding the Need for Synchronizing Slicers
In many Power BI projects, you might encounter scenarios where you need to work with multiple tables or data sources that are interconnected. For example, you might have a sales dataset and a customer dataset, both linked by a common field like Customer ID. To provide a seamless user experience, it's crucial to allow users to filter data in one table and have those filters apply to related tables as well.

Benefits of Synchronized Slicers:
-
Enhanced User Experience: Users can filter data across multiple tables with a single interaction, making it easier to explore and analyze interconnected datasets.
-
Consistency: Synchronized slicers ensure that users see consistent and coherent data, reducing confusion and potential errors in analysis.
-
Time Savings: Users can quickly drill down into specific details without the need to manually adjust slicers in multiple visuals.
Implementing Synchronized Slicers in Power BI
To synchronize slicers across different tables in Power BI, follow these steps:
-
Create Slicers for Each Table: Begin by creating slicers for each table you want to filter. You can do this by selecting a field from each table and adding it as a slicer to the report canvas.
-
Select the Slicer Visuals: Click on the slicer visual for the table that you want to act as the "master" slicer. This slicer will control the filtering for other visuals.
-
Go To "Format" in the Ribbon: Select "Edit Interactions"

-
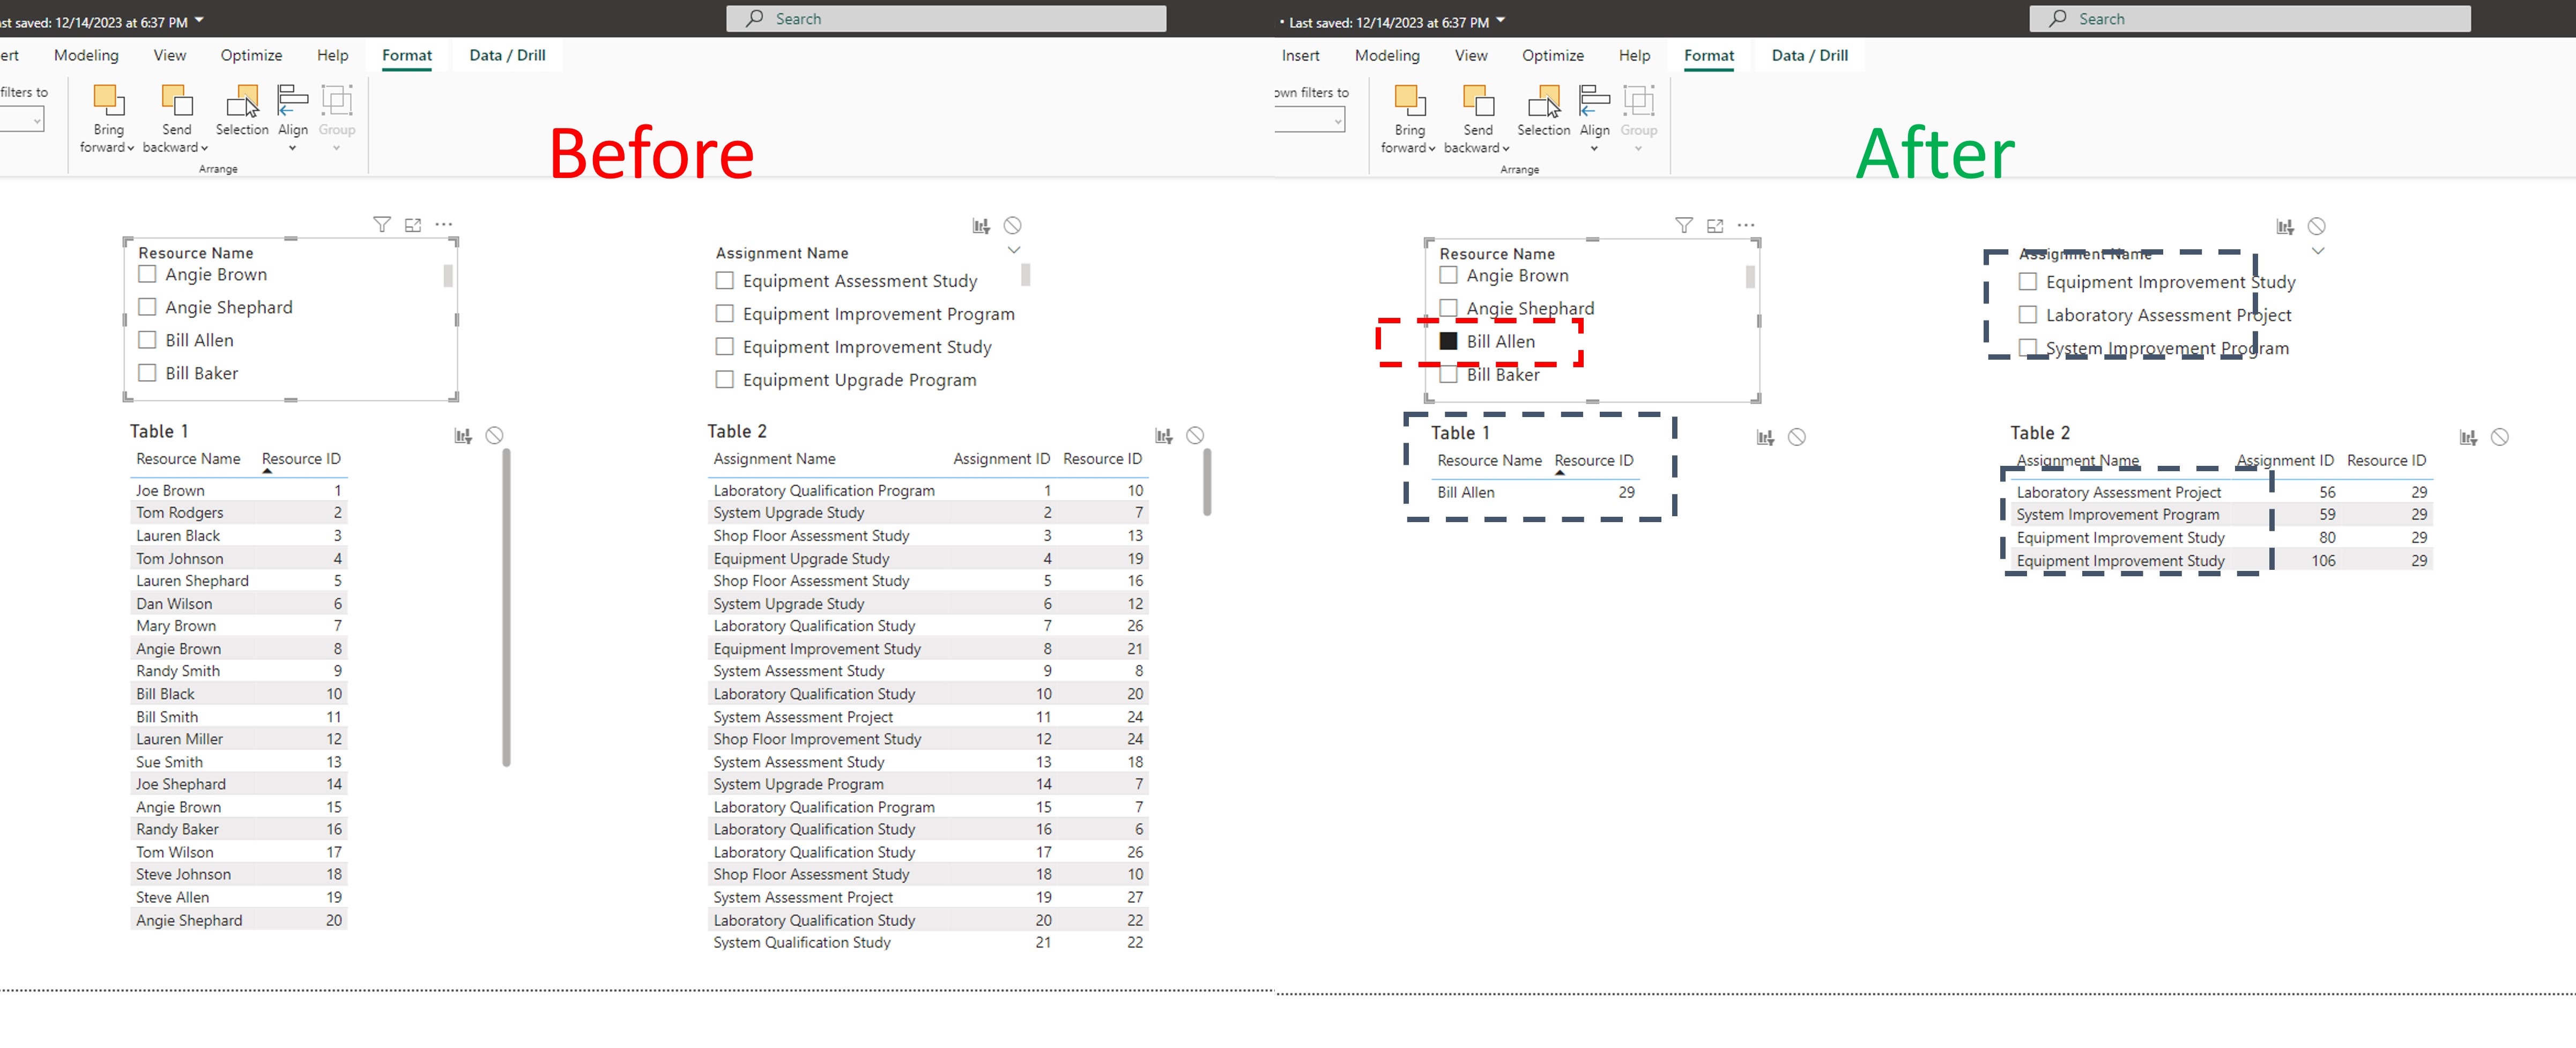
On Each Table: Make sure each Circle is de-selected. Selecting the circle shields the table from any slicer interactions. The default is deselected.

-
Test the Synchronized Slicers: Interact with the slicers and observe how selections in the "master" slicer affect visuals associated with different tables. The visuals should update to reflect the chosen filters. A single slicer controls everything on the page that's not shielded!
Additional Tips:
-
Ensure that the fields used in slicers are related in the data model. Power BI's relationships are vital for slicers to work across different tables.
-
Consider using bookmarks to save and manage different slicer states if you have complex filtering requirements.
-
Be mindful of the performance impact when synchronizing slicers, especially when dealing with large datasets. Complex filtering logic can slow down report responsiveness.
Conclusion
Synchronizing slicers across different tables in Power BI is a powerful technique that enhances the user experience and ensures data consistency when working with interconnected datasets.
By following the steps outlined in this guide, you can create reports that provide a seamless and intuitive way for users to explore and analyze data across various tables, ultimately leading to more informed decision-making and insights.
Download My Free Guidebook
The 3-Step Plan for Getting Started With PowerBI
We hate SPAM. We will never sell your information, for any reason.